Prepared by local real estate identity, Geoff Grover, The Buyer Reach Agent.
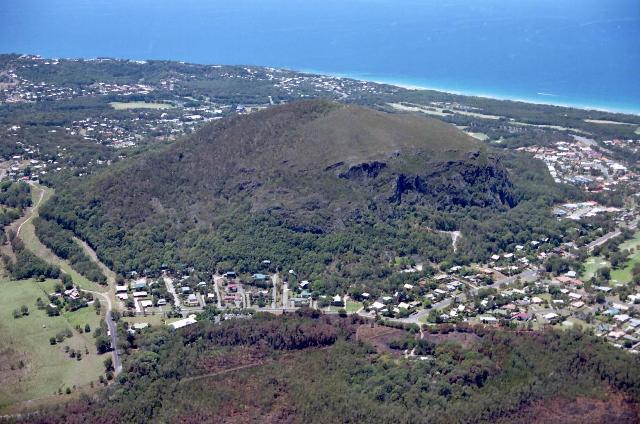
Mount Coolum is characterised by three distinct geographic areas, each with varying terrain, look and feel. Residents typically harbour strong feelings about the “value” of their area and very much prefer their “area” to the others.
North of the mount
South of the mount, the Mount Coolum golf course area.
Beachside of the David Low Way, east of the mount.
comprises the small section found along and off Tanah Street East, and in recent years includes the new Stockland “Boardwalk” development.
Mount Coolum
Sales history from 2001 to 2009
Single Residential Dwellings—HousesSuburb
Year Period Volume No. Sales Median Sale
2001 Calendar Year $22,606,800 119 $170,000
2002 Calendar Year $28,591,220 118 $225,500
2003 Calendar Year $31,487,977 96 $318,750
2004 Calendar Year $27,380,537 63 $372,500
2005 Calendar Year $35,186,415 78 $387,500
2006 Calendar Year $34,193,049 73 $376,000
2007 Calendar Year $33,361,038 70 $420,000
2008 Calendar Year $19,402,000 41 $455,000
2009 Calendar Year $41,199,548 80 $460,000
Units
Year Period Volume No Sales Median Sale
2001 Calendar Year $6,557,100 55 $116,000
2002 Calendar Year $17,935,399 130 $131,000
2003 Calendar Year $15,134,419 73 $195,000
2004 Calendar Year $21,179,394 67 $300,000
2005 Calendar Year $25,785,219 85 $285,000
2006 Calendar Year $14,222,000 49 $280,000
2007 Calendar Year $16,946,498 55 $285,000
2008 Calendar Year $15,324,000 46 $323,000
2009 Calendar Year $13,188,500 42 $302,500
Values are median averages which do not denote same house sale movements, but the averages of the houses sold, and are subject to some skewing if a particular segment, eg lower end with first home buyers changes significantly.
The development of the Boardwalk with more high end sales will undoubtedly become a significant influencing factor on this price indicator in coming years.
Same house sale prices are the only very accurate indicator, but these are useful for trends
This report attempts to provide clarity to Mount Coolum price movements over the last few years. We have almost daily reporting in the media of housing statistic sales volumes and prices from all around Australia painting various pictures –in my view there is no such thing as a useful national trend you can extrapolate to provide detailed information for your area, you have to drill down to specific locations to assess the impact of the varying pressures on housing supply and demand
It is rather difficult to imagine why a great auction clearance rate in Adelaide and Sydney last weekend will have much bearing on long term property prices in our neck of the woods. Reading some of these articles, particularly in the national and capital city press presented with breathless excitement and making such long term positive pronouncements from such limited data is unfortunately symptomatic of vested interests at work who are quoted prolifically to re-inforce their lobby interest.
DATA HIGHLIGHTS
Property prices in the Coolum precinct
– house and unit price average trends from 2004 to 2009 using median averages as a guide – indicative trend value of the precinct areas only, not a measure of actual house prices you could expect
Houses—Single Residential; Dwellings.
The huge growth spurt was from 2001 to 2004
Since then, houses have actually continued to climb in value each year by an average of 4.2% in Mt. Coolum, no major catastrophes along the way, pretty much a solid and safe story year in and year out.
By way of relative measure, Coolum Beach increased by approximately 4.5% over the same time frame.
Units - Building Community Scheme
Again, the huge growth spurt from 2001 to 2004, encompassing a large number of units sold off the plan in 2002 (Coolum Fairways) and 2005 (Coolum Villas) pushing volume numbers up significantly
From 2005, a different picture – virtually no growth at all , with a lot of stock coming on board at the upper end in Mt. Coolum during this year adding to current unsold stock and will present an interesting time ahead.
The picture for Coolum Beach, and indeed virtually the entire Sunshine Coast depicts a similar static picture for unit median values.
Subscribe to:
Post Comments (Atom)

express post tracking
ReplyDeletecourier
couriers
international tracking
interstate couriers
same day delivery
cheapest courier
courier australia
courier services
freight calculator australia
couriers melbourne
same day courier
delivery service
delivery services
courier sydney
dtdc australia
unaccompanied baggage
cheap courier
couriers perth